Turn Data & Insights into
Infographic Images
Transform text lists, industry stats, and comparative metrics into beautifully structured visual charts and infographics built for LinkedIn virality.
The editor is free and needs no account. AI generation runs on credits.
What image do you want to create?
Describe your topic and I'll generate a data-rich infographic for your post.
Describe your infographic — topic, key stats, sections, style...
Turn Lists & Stats into High-Converting Infographics
Structured visual graphics get 3x higher saves, reposts, and feed retention on LinkedIn.
Smart Data Visualizer
Input raw text, numbered lists, or industry stats and watch AI structure them into high-contrast visual cards.
Pre-Built Graphic Frameworks
Choose from 5 numbered tips, before-vs-after matrices, step-by-step guides, or top 3 mistakes templates.
High Shareability & Save Rates
Infographic images generate 3x more bookmarks and reposts on LinkedIn compared to standard text posts.
Structured Visual Infographic Cards
Render high-contrast, publication-ready infographics directly in your post workflow.
Growth Assistant
Always ready to help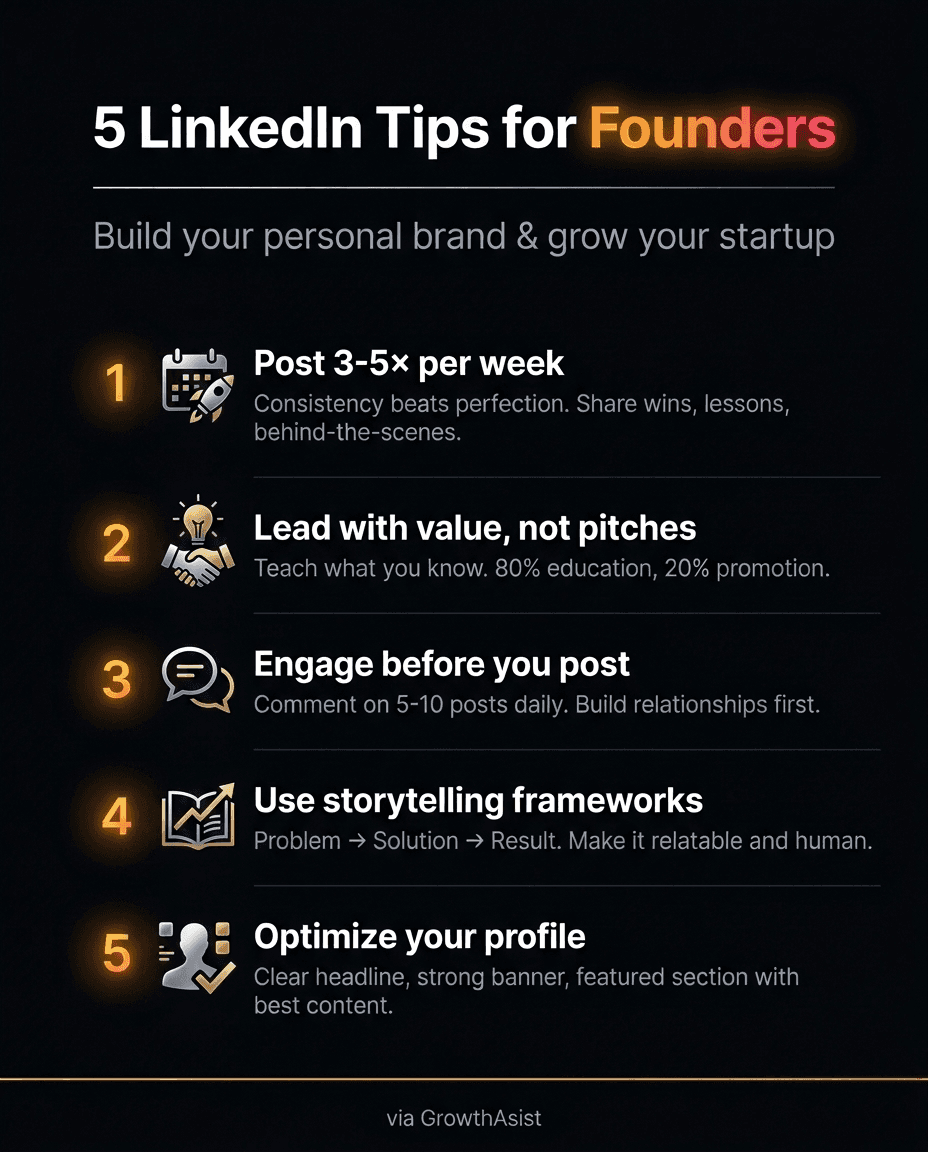
How Infographic Creation Works
Turn data into visual graphics in 3 simple steps.
Input Stats or List
Paste key numbers, comparisons, or numbered steps into the Infographic prompt box.
Select Infographic Style
Select from 5 numbered tips, step-by-step guides, or before-vs-after graphic cards.
Attach & Share
Click "Use this image" to attach the rendered infographic graphic directly to your post draft.
Or build one yourself, right now
44 editable designs — funnels, pyramids, matrices, cheat sheets, growth curves. Pick one, replace the words, add your photo and logo, download the image. Nothing to sign up for.
An account adds the AI: write a design from a topic, rebuild one from a picture, and publish straight to LinkedIn.
Make your data visual and viral
Turn complex metrics into easy-to-digest infographic post images.
Get Started Free